🎯 نواتج التعلم
🎯 Learning Outcomes
بعد هذه التجربة ستكون قادرًا على أن:
After this experiment you will be able to:
- تربط بين رسوم الموقع–الزمن والسرعة–الزمن والتسارع–الزمن لحركة بتسارع ثابت.Relate the position–time, velocity–time and acceleration–time graphs of motion with constant acceleration.
- تقرأ التسارع من ميل رسم السرعة–الزمن والإزاحة من المساحة تحته.Read the acceleration from the slope of the velocity–time graph and the displacement from the area under it.
- تضبط السرعة الابتدائية والتسارع لتطابق رسمًا بيانيًا معطى.Adjust the initial velocity and the acceleration to match a given graph.
🎬 شاهد الفيديو
🎬 Watch the Video
📈 الرسوم البيانية للحركة بتسارع ثابت
📈 Graphs of Motion with Constant Acceleration
في الحركة بتسارع ثابت \(a\) تتغير السرعة خطيًا مع الزمن، ويكون لكل كمية رسم مميّز: رسم التسارع–الزمن خط أفقي، ورسم السرعة–الزمن خط مستقيم ميله \(a\)، ورسم الموقع–الزمن قطع مكافئ.
In motion with constant acceleration \(a\) the velocity changes linearly with time and every quantity has a characteristic graph: the acceleration–time graph is a horizontal line, the velocity–time graph is a straight line of slope \(a\), and the position–time graph is a parabola.
📘 العلاقات بين الرسوم
📘 Relations between the graphs
\[a=\text{constant}\qquad v=v_0+at\qquad x=x_0+v_0t+\tfrac12at^2\]
\[a=\text{slope of }v\text{–}t\qquad \Delta x=\text{area under }v\text{–}t\qquad v=\text{slope of }x\text{–}t\]
💡 كيف تقرأ كل رسم؟
💡 How to read each graph?
- a–t: الخط الأفقي فوق المحور \(a\gt 0\) وتحته \(a\lt 0\).a–t: a horizontal line above the axis means \(a\gt 0\) and below it \(a\lt 0\).
- v–t: يقطع الخط المحور الرأسي عند \(v_0\)، وميله \(a\)؛ وحيث يقطع محور الزمن تكون \(v=0\) (لحظة التوقف اللحظي).v–t: the line cuts the vertical axis at \(v_0\) and its slope is \(a\); where it cuts the time axis \(v=0\) (the instant of momentary rest).
- x–t: قطع مكافئ يفتح لأعلى إذا \(a\gt 0\) ولأسفل إذا \(a\lt 0\)؛ وميل المماس عند أي لحظة هو السرعة اللحظية، وقمته (أو قاعه) عند \(v=0\).x–t: a parabola opening upward if \(a\gt 0\) and downward if \(a\lt 0\); the slope of the tangent at any instant is the instantaneous velocity, and its top (or bottom) is at \(v=0\).
🧪 تجربة 1: اضبط التسارع وراقب الرسوم الثلاثة
🧪 Experiment 1: Tune the acceleration and watch the three graphs
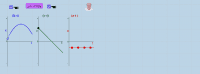
غيّر الموقع الابتدائي \(x_0\) والسرعة الابتدائية \(v_0\) والتسارع \(a\) فتتغير الرسوم الثلاثة معًا. حرّك مؤشر الزمن (أو اضغط «شغّل» لتتحرك النقطة على الرسوم) لترى القيم عند كل لحظة. للتحدّي: اضغط «تحدٍّ جديد» فيظهر رسم سرعة–زمن هدف (متقطّع) فاضبط \(v_0\) و\(a\) ليطابقه ثم اضغط «تحقق». لا شيء يتحرك من تلقاء نفسه.
Change the initial position \(x_0\), the initial velocity \(v_0\) and the acceleration \(a\) and the three graphs change together. Move the time slider (or press “Play” so the point moves on the graphs) to see the values at every instant. For a challenge press “New challenge”: a target velocity–time graph (dashed) appears; adjust \(v_0\) and \(a\) to match it then press “Check”. Nothing moves by itself.
🧪 تجربة 2: حاسبة: اقرأ الرسم
🧪 Experiment 2: Calculator: read the graph
مسألة جديدة في كل مرة تصف نقطتين على خط السرعة–الزمن. احسب القيم الثلاث ثم اضغط «صحّح».
A new problem every time describing two points on the velocity–time line. Calculate the three values and press “Check”.
🛠️ تطبيقات عملية
🛠️ Practical applications
- تحليل أداء السيارات: قراءة تسارع سيارة من رسم السرعة والزمن.Analysing cars: reading the acceleration of a car from its velocity–time graph.
- مجسّات الحركة في المختبر: تعطي رسوم x–t وv–t وa–t مباشرة.Motion sensors in the lab: they give the x–t, v–t and a–t graphs directly.
- الرياضة: تحليل انطلاق العدّاء ثم تباطئه.Sports: analysing the start of a runner and then his slowing down.
✍️ أمثلة محلولة
✍️ Worked Examples
خط السرعة–الزمن يمر بالنقطتين \((0,\ 8\ \mathrm{m/s})\) و\((4\ \mathrm{s},\ 0)\). أوجد التسارع والإزاحة خلال \(4\ \mathrm{s}\).
The velocity–time line passes through the points \((0,\ 8\ \mathrm{m/s})\) and \((4\ \mathrm{s},\ 0)\). Find the acceleration and the displacement during \(4\ \mathrm{s}\).
جسم \(v_0=6\ \mathrm{m/s}\) وتسارعه \(-2\ \mathrm{m/s^2}\). متى تنعدم سرعته وأين قمة رسم الموقع؟ (\(x_0=0\))
A body has \(v_0=6\ \mathrm{m/s}\) and an acceleration of \(-2\ \mathrm{m/s^2}\). When is its velocity zero and where is the top of its position graph? (\(x_0=0\))
سيارة تزيد سرعتها من \(2\) إلى \(14\ \mathrm{m/s}\) في \(6\ \mathrm{s}\). احسب التسارع والإزاحة.
A car increases its velocity from \(2\) to \(14\ \mathrm{m/s}\) in \(6\ \mathrm{s}\). Calculate the acceleration and the displacement.
ما شكل الرسوم الثلاثة لجسم يتحرك بتسارع موجب ثابت يبدأ من السكون؟
What are the shapes of the three graphs for a body moving with a constant positive acceleration starting from rest?
ميل رسم السرعة–الزمن يمثل:
The slope of the velocity–time graph represents:
رسم التسارع–الزمن لحركة بتسارع ثابت سالب هو:
The acceleration–time graph for motion with a constant negative acceleration is:
المساحة بين خط السرعة–الزمن ومحور الزمن تمثل:
The area between the velocity–time line and the time axis represents:
رسم الموقع–الزمن لحركة بتسارع ثابت غير صفري هو:
The position–time graph for motion with a non-zero constant acceleration is:
📚 ملخص
📚 Summary
| الرسمGraph | الشكلShape | المعنىMeaning |
|---|---|---|
| \(a\text{–}t\)\(a\text{–}t\) | خط أفقيhorizontal line | قيمة التسارعthe value of the acceleration |
| \(v\text{–}t\)\(v\text{–}t\) | خط مستقيمstraight line | الميل = a والمساحة = Δxslope = a and area = Δx |
| \(x\text{–}t\)\(x\text{–}t\) | قطع مكافئparabola | ميل المماس = vslope of the tangent = v |
⚠️ أخطاء شائعة
⚠️ Common mistakes
- الظن بأن ميل رسم الموقع–الزمن هو التسارع؛ هو السرعة.Thinking the slope of the position–time graph is the acceleration; it is the velocity.
- نسيان إشارة المساحة تحت المحور (إزاحة سالبة).Forgetting the sign of the area below the axis (a negative displacement).
- الخلط بين قمة القطع المكافئ (توقف لحظي) ونهاية الحركة.Confusing the top of the parabola (momentary rest) with the end of the motion.
🔗 محاكيات GeoGebra للاستعانة بها عند اللزوم
🔗 GeoGebra Simulations to Use When Needed
اضغط «تشغيل» لتعمل المحاكاة هنا داخل الدرس؛ ويمكن للطالب الرجوع إليها لتجربة الفكرة بطريقة أخرى.
Press “Run” to run the simulation right here inside the lesson; the student can use it to try the idea in another way.